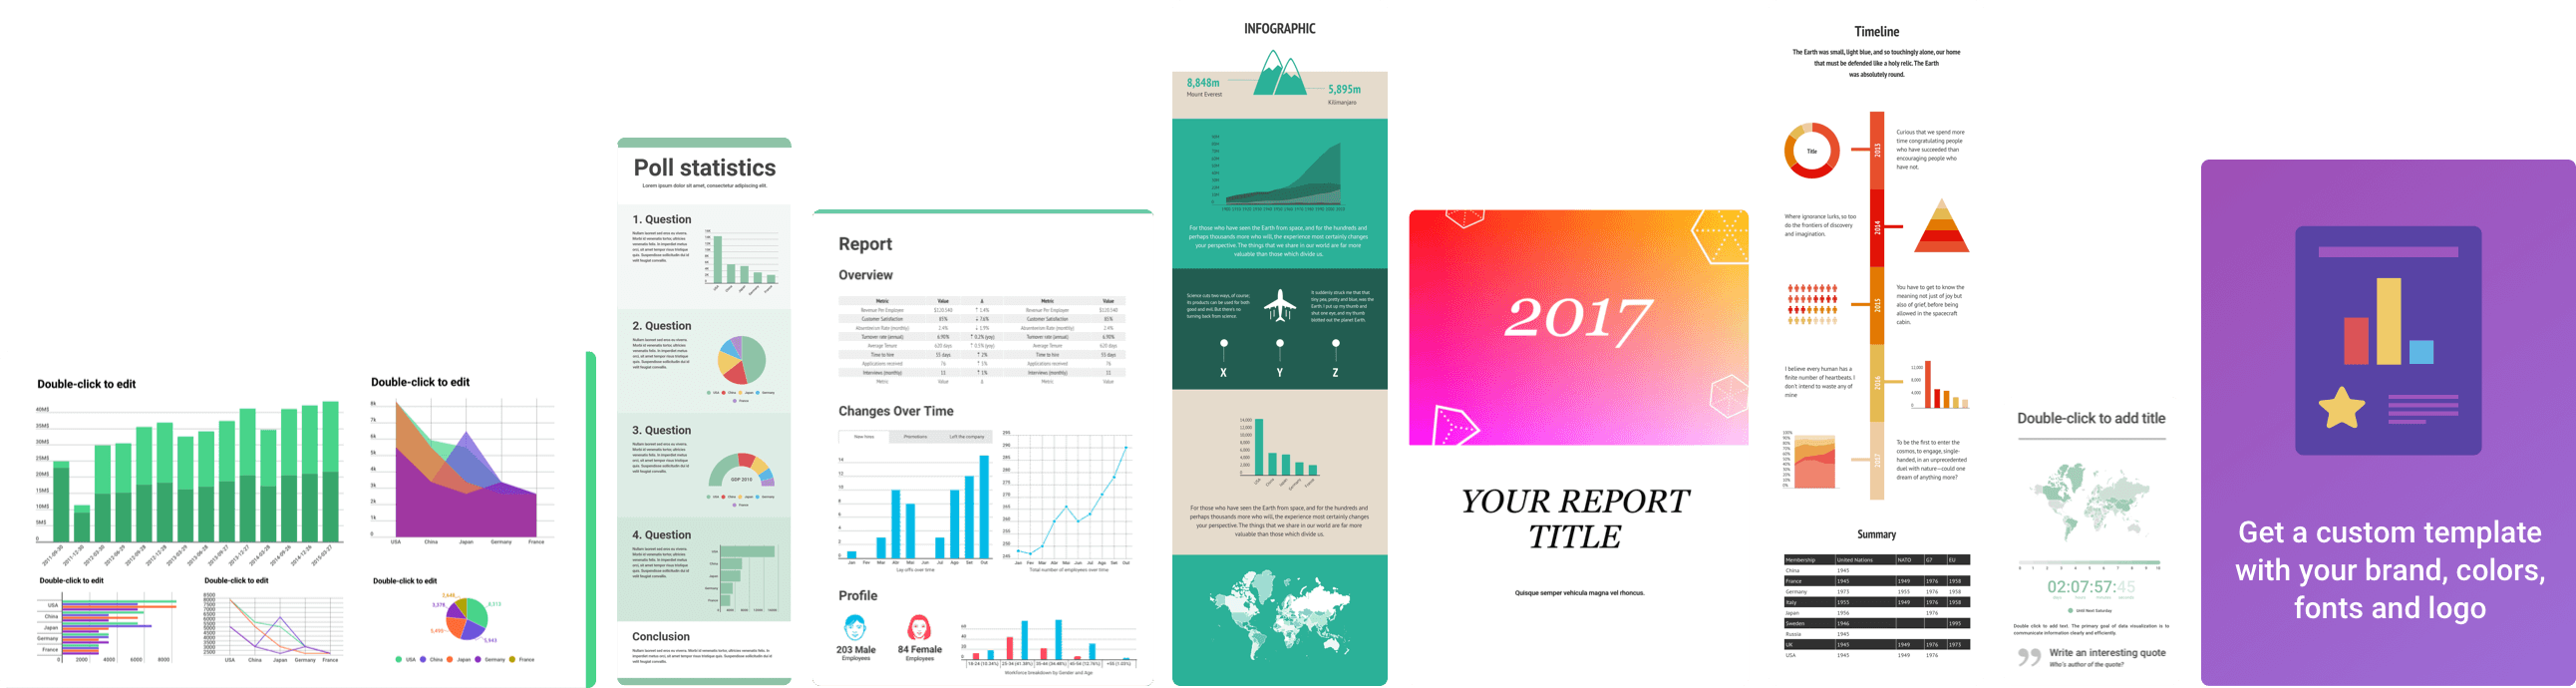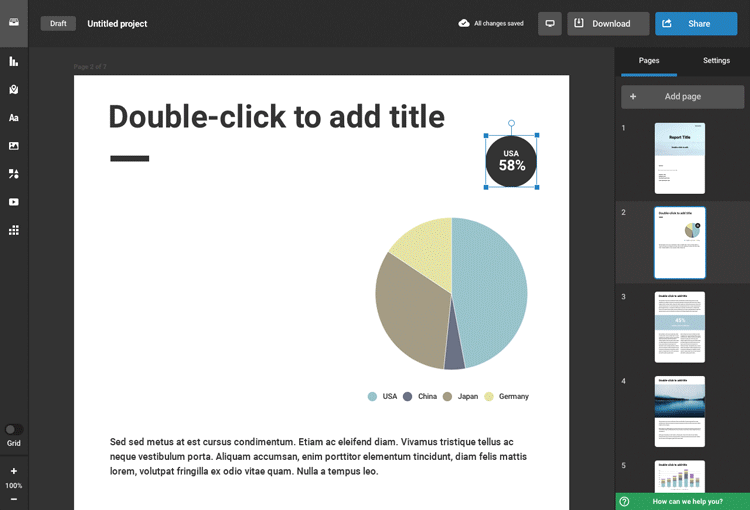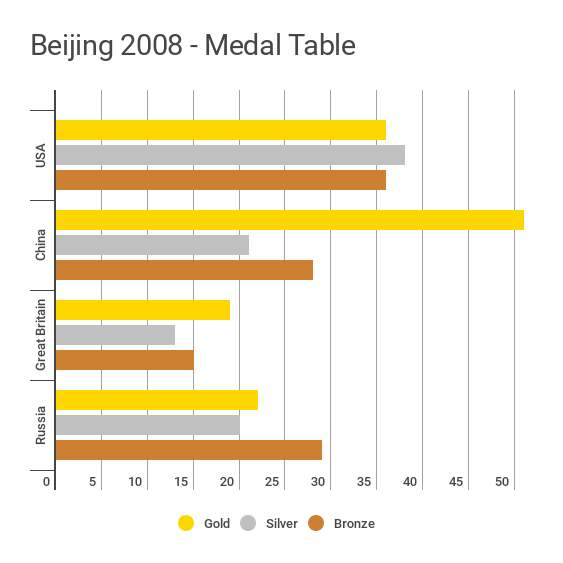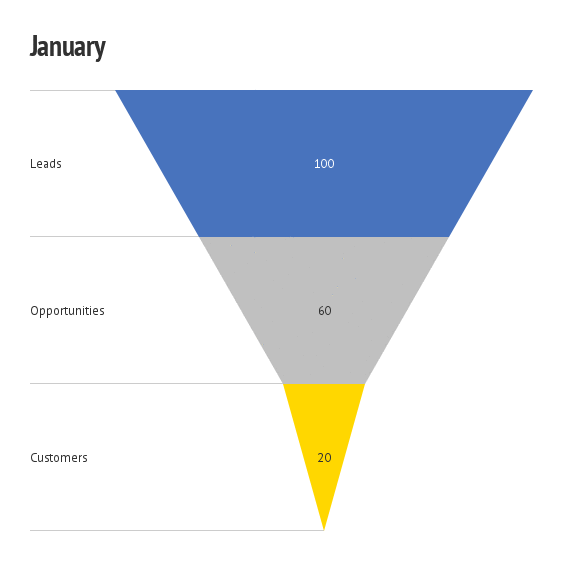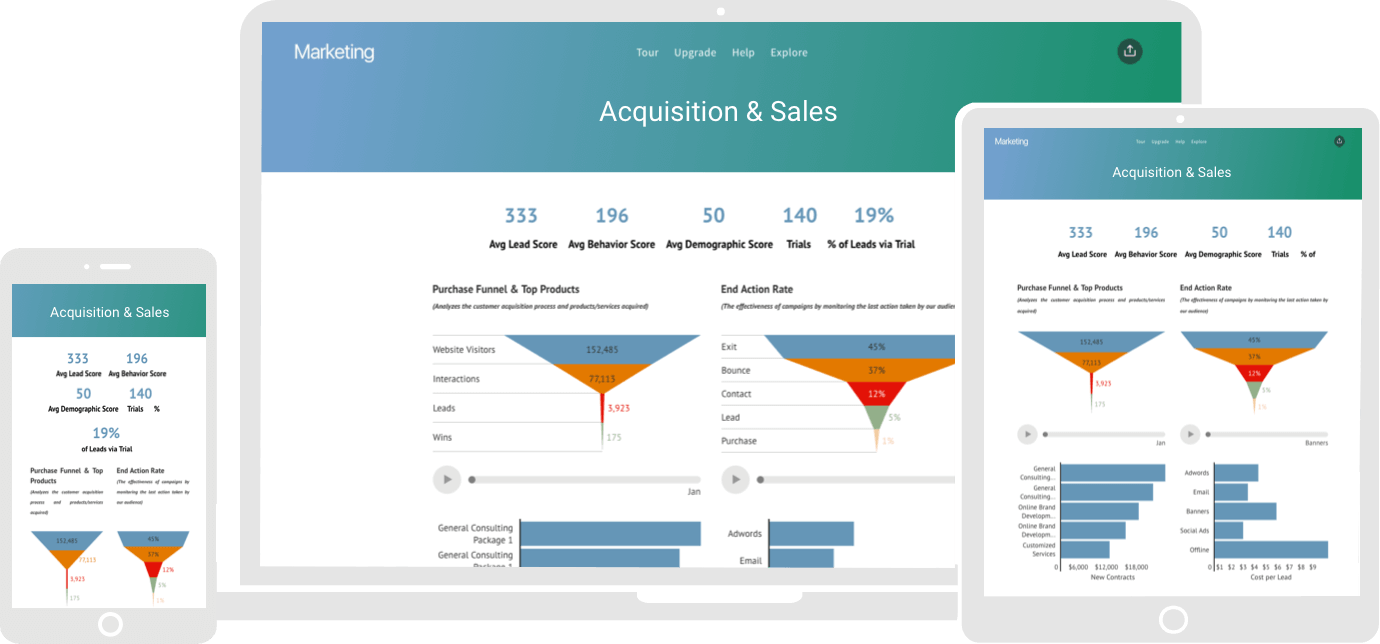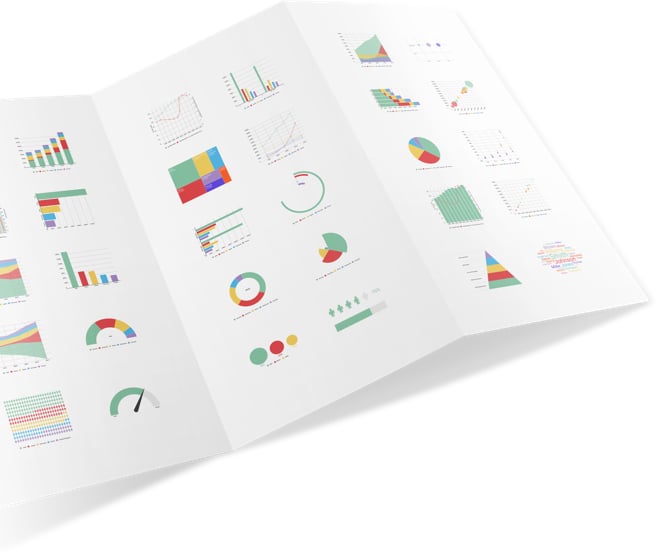
Charts, graphs, maps, and more
More than 35 interactive charts and over 550 maps to help you visualize data, including pie charts, bar graphs, column tables, and word clouds.
35+
Charts
550+
Maps