
Capture Audience Attention with Interactive Visuals
Create engaging and data-driven content that resonates with your audience.


4.7 out of 5 stars


Overview
Why
Features
Examples
Reviews
Tips
FAQ
Capture Audience's Attention
In the dynamic digital media and publishing landscape, capturing your audience's attention is crucial. That's where Infogram's media solutions come in. Our platform equips you with the tools you need to create engaging, data-driven content that resonates with your audience. In an age where information overload is the norm, your content must stand out. With Infogram's media solutions, your content will shine through the noise, allowing your audience to not just consume, but also interact with your data, leading to increased understanding and engagement.
Whether you're a digital publisher, journalist, or content creator, Infogram simplifies the process of creating visually stunning, interactive visualizations. Our user-friendly interface streamlines the process from data import to the final product. This frees up your time to focus on creating compelling narratives that captivate your audience.
Infogram enables you to seamlessly embed your projects into your digital content, enhancing your narrative with interactive maps, charts, and tables. You can maintain brand consistency across your projects, elevating your storytelling to new heights.
And that's not all. With Infogram's comprehensive analytics, you'll have invaluable insights at your fingertips. This empowers you to optimize your content strategy based on real audience feedback, ensuring your stories hit the mark every time.
Embrace the power of Infogram and turn your data into compelling stories that truly resonate with your audience. Get started today and see the difference for yourself.
7 Reasons to Try Infogram Today
Discover the reasons why you should try Infogram and revolutionize your visual content.
Transform Data into Interactive Visuals
With Infogram's digital media solutions, you're not just presenting data — you're telling a story. Our software empowers you to transform raw data into captivating, interactive maps, charts, and tables. By utilizing features like tooltips, clickable legends, and zoomable interfaces, you’ll provide a multi-dimensional view of your data. This interactive experience allows your audience to explore the information, leading to deeper understanding and increased engagement.
Furthermore, creating visually appealing narratives brings a new level of professionalism to your content and sets you apart from the competition. The way you present your data can be the difference between keeping your audience interested and losing their attention, making Infogram's digital media solutions a crucial tool in your arsenal.
Schedule a demo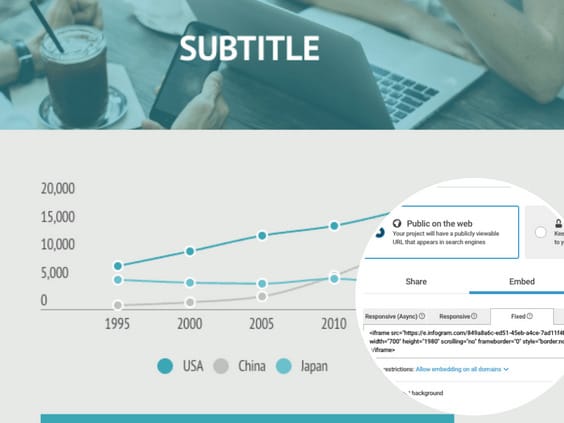
Easily Embed Interactive Content
Keep your audience focused and engaged by embedding interactive projects directly into your website or blog with Infogram's digital media solutions. This feature creates a dynamic and immersive user experience, allowing your audience to interact directly with your content right from your site.
Enhancing their understanding of your data and boosting engagement has never been easier. Plus, by keeping the audience on your site, you’ll increase the likelihood of them exploring other content, thereby increasing time spent on your site and potentially boosting your SEO rankings. It also offers a smooth user experience by removing the need for audience members to navigate to external pages to view your data.
Schedule a demo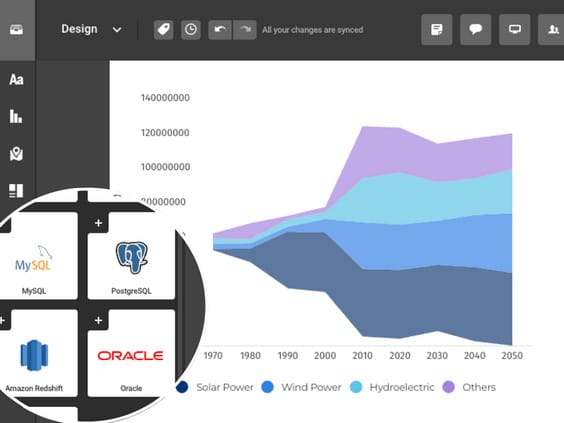
Seamless Data Import
Data accessibility is essential for any digital publisher, and with Infogram's solutions, connecting to your data has never been simpler. Importing data from a wide variety of online databases, such as MySQL, PostgreSQL, Amazon Redshift, Oracle, and Microsoft SQL Server is easy. Infogram ensures your data entry process is straightforward and efficient, so your visualizations always have access to the most current information.
In return, you can invest the time saved in creating more insightful and impactful content. In addition, accurate, up-to-date data is crucial for establishing trust with your audience and making informed business decisions.
Schedule a demo
Boost Engagement with Interactive Elements
Infogram's digital media solutions take your visualizations to the next level with interactive elements. Features such as tooltips, clickable legends, and drill-down functionality provide your audience with an opportunity to explore your data in more depth. These elements improve their understanding of the information, resulting in heightened engagement and a richer user experience.
These interactive features provide an element of interactivity that appeals to the curiosity of the audience and encourages them to engage further with your content. Also, a more engaged audience is more likely to share your content, thus expanding your reach and influence.
Schedule a demo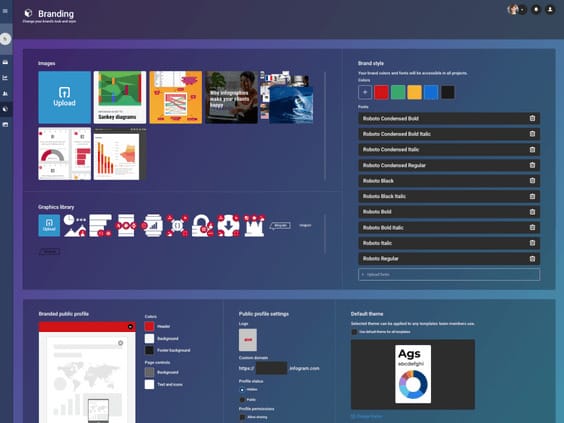
Maintain Brand Consistency
Consistency is key in branding, and with Infogram's media solutions, you can ensure brand alignment across all your interactive content. Upload your brand assets, such as logos, color schemes, and fonts, and apply them across all your Infogram projects. This guarantees that every chart, infographic, or map you create is consistently reflective of your brand identity.
Not only consistent branding creates a unified image, but it also builds recognition and trust with your audience. The digital media solutions also save time by automating brand styling, freeing you up to focus on creating compelling content.
Schedule a demo
Enrich Content with Animated Stickers and GIFs
Revolutionize your content with animated stickers and GIFs thatadd a dash of creativity and fun to your digital narratives. Not only these elements make your content more appealing, but they also improve its shareability, significantly enhancing audience engagement. Transform static data visualizations into dynamic visual stories that evolve over time, bringing your data to life.
This adds a layer of entertainment to your content, which could be the factor that keeps your audience coming back for more. Additionally, animated visuals are known to be more memorable, which increases the likelihood that your content will make a lasting impression.
Schedule a demo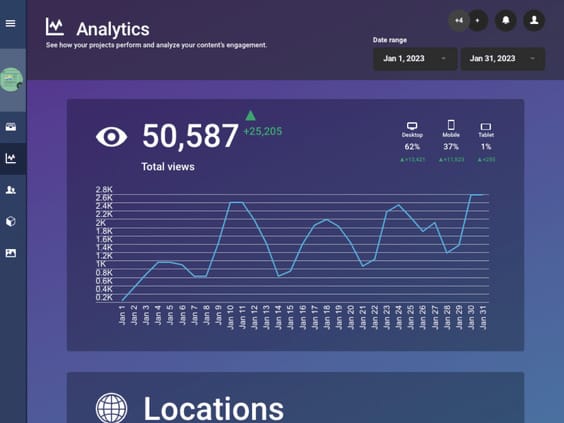
Uncover Valuable Insights with Comprehensive Analytics
Drive your digital strategy with data. Infogram's analytics feature provides tools to reveal deep insights about audience engagement and content shares. Track views, clicks, and more to understand the impact of your content and make data-driven decisions for optimizing engagement.
This valuable information is integral to refining your content strategy and ensuring that your content remains relevant and impactful. It's an easy way to measure the success of your content and identify areas for improvement. Discover the power of Infogram and elevate your digital publishing efforts. Start creating engaging, data-driven content that captivates your audience and delivers real results.
Schedule a demoExplore Most Loved Features

Data Import
Infogram enables you to seamlessly import data from Excel, Google Sheets, databases, and more. Leverage our integrations and import capabilities to bring your data effortlessly into the reporting environment.

Chart Library
Infogram's extensive chart library provides an array of chart types, including bar charts, line graphs, pie charts, and more. Customize your charts with ease by adjusting colors, labels, and formatting to present your data in a compelling way.

Map Library
Infogram's map library lets you visually represent geographic data in a compelling and easy-to-understand format. Choose from various styles and formats to best fit your narrative.

Project Embeds
Infogram's project embeds allow you to integrate interactive visualizations directly into your website or blog. This feature provides a more engaging and interactive experience for your audience, enhancing their understanding of your data and boosting engagement.

Annotations and Callouts
Add context to your data visualizations with annotations and callouts. These features allow you to add explanatory text, highlights, and insights to your reports, ensuring your audience comprehends the presented information fully.

Content Engagement Analytics
Get invaluable insight into how your audience interacts with your content. Track their behavior to understand what resonates with them, identify the elements that drive engagement, and use this data to refine and enhance your future content strategy.

Real-Time Collaboration
Seamlessly collaborate with your team members, editors, and contributors in real time. Share projects, leave comments, and track changes, ensuring efficient teamwork and a streamlined content creation process.

Brand Kit
Infogram's brand kit lets you ensure your brand consistency across all projects. Upload your brand's logos, color schemes, and fonts, and apply them across all your Infogram projects.
Get Inspired by Infogram User Created Projects
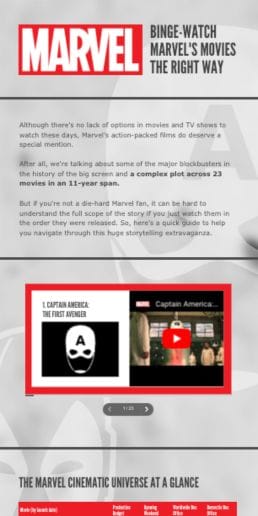
Marvels Movies Binge-Watch the Right Way

10 Years After the Deepwater Horizon Oil Spill

This Is Our Solar System

Floyd Mayweather Jr. Vs Conor Mcgregor
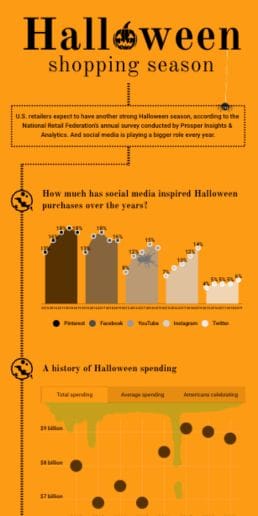
Halloween Shopping Season

A Different Kind of March Madness

Women of the Nobel Prize

A Royal Wedding
Customer Reviews
Here is what our customers have to say about us.
2022 Summer & Fall and 2023 Winter leader in Data Visualisation Software 4.7 out of 5 stars
See reviews on G2 ›Empowering 30,000+ Companies Worldwide
From startups to established enterprises, our platform has been embraced by a diverse range of businesses seeking to captivate audiences and simplify complex data. Here are just a few examples of the 30,000+ companies that use Infogram.


Learn More Practical Tips
Media
From raw data to compelling narrative: Data journalism definition & examples
Design
The best data visualization projects of 2023
Design
Creating effective infographics: dos and don'ts
Marketing
Crafting a persuasive data story: Key ingredients
Marketing
Amplify engagement with interactive data visualizations
Marketing
Data storytelling: Ingredients to an effective data story
Frequently Asked Questions
Why is interactive content useful?
Interactive content is useful for several reasons:
- Increased Engagement: Interactive content is more engaging than traditional content because it allows users to participate actively and interact with the content. This can lead to higher levels of engagement, which can help to improve retention and increase the chances of users sharing the content with their friends and followers.
- Personalization: interactive content can be personalized to the user's interests or needs, making it more relevant and useful.
- Brand Awareness: Interactive content can help to increase brand awareness by providing a unique and memorable experience that users are likely to share with their friends and followers. This can help to increase your reach and build brand loyalty.
- Improved User Experience: Interactive content can help to improve the user experience by providing a more enjoyable and informative experience that meets their needs and interests.
How do you create interactive content in Infogram?
- Open your library.
- Choose a project you want to create (infographics, reports, slides etc.)
- If you want some inspiration, choose one of many Infogram templates or select a blank template to start from scratch.
- After you have chosen your project type and template, you can start editing your project (you can add charts, maps and other graphic elements that better suit your project).
Can I collaborate with my team on a project in Infogram?
Yes, Infogram provides real-time collaboration features that allow you to share reports with your team, gather feedback, and work together to create impactful reports.
How can Infogram help me present data in an engaging way?
Infogram's chart library, interactive elements, and customizable design features enable you to present data in a visually appealing and interactive manner, capturing your audience's attention and enhancing their understanding.
How to import data into your chart?
You can also import data into charts from your computer, Google Drive, Dropbox, or several databases. Infogram supports the following formats: .xls (.xlsx), .csv, Google Sheets, JSON, and databases (MySQL, PostgreSQL, Amazon Redshift, Oracle, Microsoft SQL).Note: Infogram doesn't support formulas, only raw data. If you import data from Excel, make sure it has only plain data in the cells, as the formulas won't work on Infogram.
- Go to the Edit data tab in the Settings panel on the right or double-click the chart to access its data table.
- Use one of the file import buttons above the data table.
What are content engagement analytics?
Analytics is an essential tool for measuring the success of your published content in the digital realm. With the ability to track key metrics and analyze data from different sources, you can gain important insights into the performance of your content strategy. This information allows you to optimize your approach and make data-driven decisions to drive engagement, conversions, and revenue growth.
What kind of metrics can I track with content engagement analytics?
With content engagement analytics, you can track different metrics, including views, engagement rates, viewer demographics, device types, and even specific interactions like clicks on tabs, legends, and other objects.
Didn't find the answer? Check our FAQs

Try Infogram Now!
Are you ready to unleash the power of data visualization? Get started with Infogram today and create stunning, interactive content that captivates your audience. Elevate your projects and bring data to life.