Financial chart
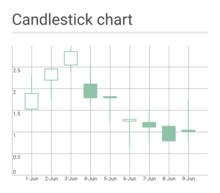
Waterfall charts are used to show how different factors (represented by columns) contribute to a final result. Waterfall charts are great for performance analysis, inventory audits, and headcount review. Candlestick charts are traditionally used to show price movements between comparable periods of time, usually within and between trading days.
Start your first project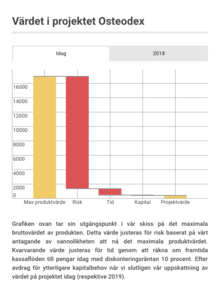

Features
Interactive Content
Embeds
Brand kit
Accessible content
Content engagement analytics
Team templates
Data import and live data
Custom maps
Integrations
Templates
All features