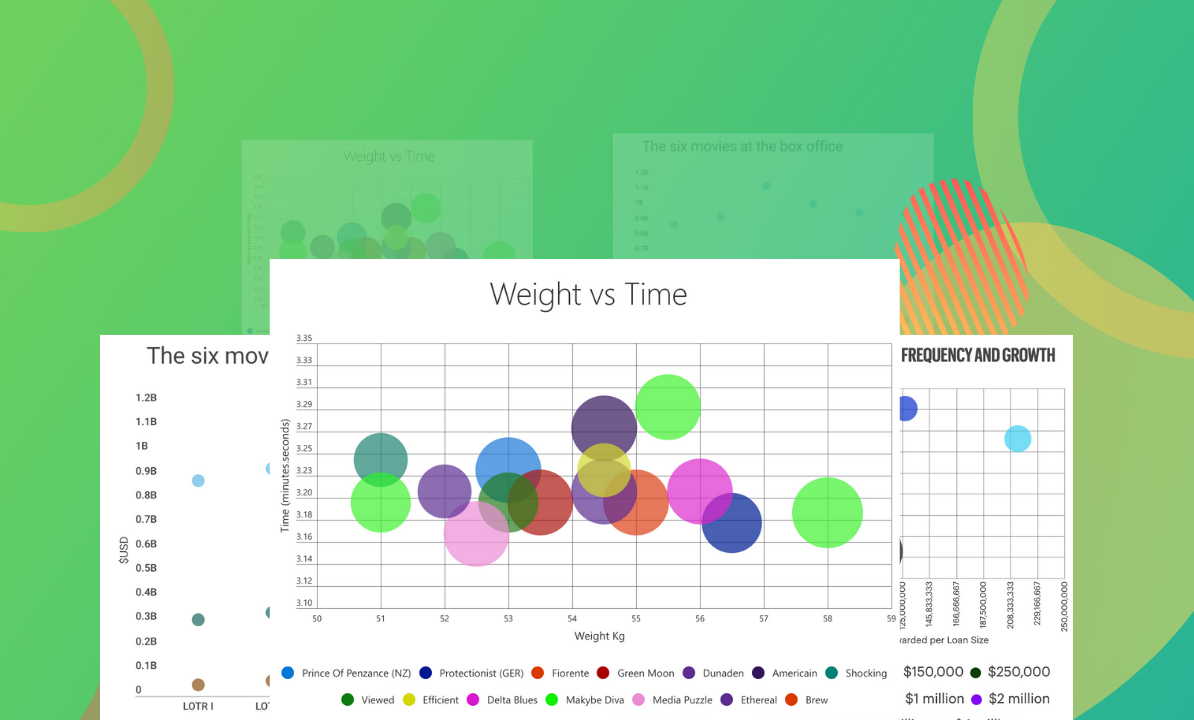
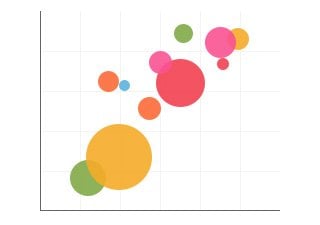
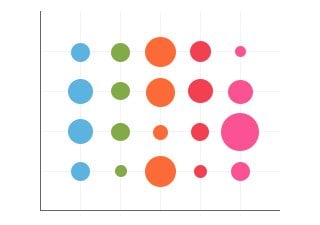
A bubble chart is a visual representation of data objects in 3 numeric data dimensions (the X-axis data, the Y-axis data, and data represented by the bubble size). Instead of using just the X and Y-axis to share data (like a bar graph or column chart), the bubble chart uses a third dimension (sometimes referred to as the Z-axis) to share another dimension of data. Bubble charts share the relationships between these three points of data.
Bubble charts are best used to compare and show relationships between each bubble (or circle) on the chart through positioning and different proportions.
Be careful when trying to use a bubble chart to share a lot of data points, though. When there are too many bubbles on a chart, the information isn’t clear to the viewer. Using interactive charts, where a hovering mouse can increase or animate each data points, will help the viewer stay engaged longer while you get to tell a great data-driven story.
This page covers the basics of where to use interactive bubble charts, the types of charts Infogram offers, how to get started, and frequently asked questions. Don’t worry, we’re handling the complicated technical pieces, allowing you to focus on creating engaging, exciting, and educational content that will delight your customers.
 Infogram