
Unlock the Power of Visual Storytelling
Enhance your brand storytelling with impactful data visualizations and interactive elements, boosting audience engagement and amplifying brand visibility.


4.7 out of 5 stars


Overview
Why
Features
Examples
Reviews
Tips
FAQ
Rise Above the Crowd
In today's competitive digital marketing landscape, it's crucial to stand out. That's why our powerful digital marketing solution is here to help you rise above the crowd. With our platform, you can easily create compelling, data-driven content that engages your audience and amplifies your brand message. We make it simple for you to transform your digital marketing content into an interactive experience that informs and captivates your audience, leading to increased conversion rates and brand loyalty.
Whether you're a marketing manager, content marketer, or digital strategist, our digital marketing solution simplifies the process of creating visually impressive, interactive visualizations. Our intuitive interface streamlines everything from data import to the final product, giving you more time to focus on crafting captivating narratives that truly engage your audience.
Integrate your visual projects seamlessly into your digital marketing content, enhancing your storytelling with interactive charts, engaging infographics, captivating maps, and more. By effortlessly incorporating these dynamic visual elements, you can effectively convey complex information in an engaging and easily understandable format. This enables you to captivate your digital marketing audience and leave a lasting impression.
Ensure brand consistency across all your digital marketing projects with ease. By maintaining a cohesive visual presence, you can reinforce your brand identity and create a strong and recognizable brand image. Consistency in design elements such as logos, colors, and fonts builds trust and familiarity with your digital marketing audience, strengthening your brand's impact in the digital space.
Gain valuable insights through our comprehensive analytics, empowering you to optimize your digital marketing strategy based on real audience feedback. By analyzing this data, you can gain a deeper understanding of what resonates with your digital marketing audience. This knowledge allows you to make informed decisions and fine-tune your digital marketing campaigns for maximum impact. By leveraging these insights, you can ensure that your digital marketing content speaks directly to your audience's needs and preferences.
Unlock the power to transform your digital marketing data into compelling marketing stories that truly resonate with your audience. By utilizing our digital marketing tools and features, create visually stunning and engaging content that captures attention, drives engagement, and achieves your digital marketing goals. Start your digital marketing journey today and experience the difference for yourself!
8 Reasons to Try Infogram Today
Discover the reasons why you should try Infogram and revolutionize your visual content.

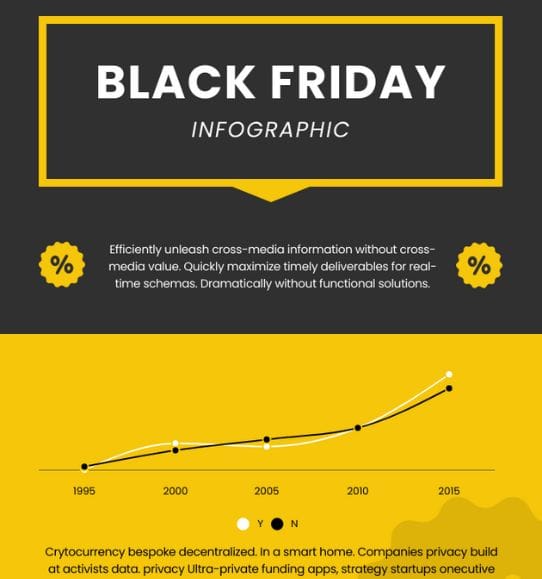
Elevate your Narrative with Animated Elements
Captivate your audience and boost engagement with a wide range of animated designs and graphics. From animated GIFs to dynamic bar chart races, these elements will capture attention and drive interaction, making your online marketing campaigns truly stand out.
Take your visual storytelling to new heights by incorporating mesmerizing video covers and applying subtle effects like zooming, bouncing, flipping, or fading for a seamless and professional finish that leaves a lasting impact.
Schedule a demo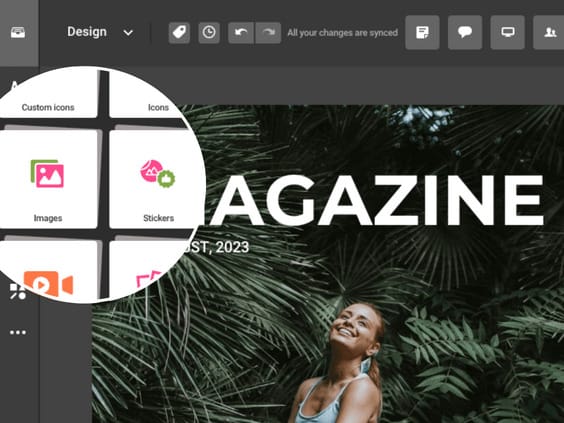
Your One-Stop Destination for Design Essentials
Access a vast collection of high-quality images, videos, GIFs, and illustrations to enhance your content marketing projects. Infogram seamlessly connects you with renowned libraries such as Unsplash and Giphy, ensuring that you have an extensive array of visual resources at your fingertips.
Easily upload your own visuals or choose from the library, and utilize our user-friendly tools to adjust contrast, brightness, add filters, and apply effects, allowing you to customize your visuals to perfection. With the image masking feature, you can create unique visuals that align with your brand identity, reinforcing brand consistency and making your content marketing materials truly stand out.
Schedule a demo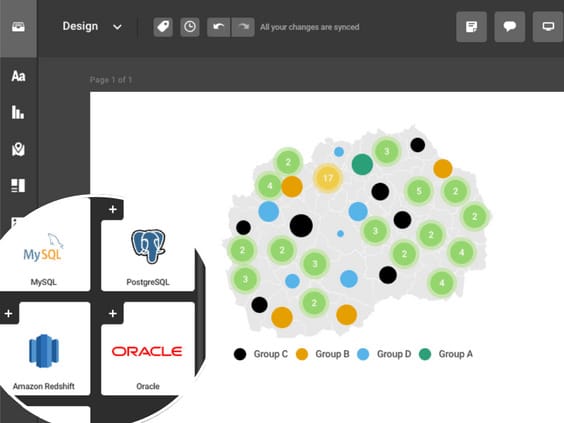
Amplify your Narrative with Data, Maps, and More
Effectively convey complex ideas with clarity and depth by leveraging a comprehensive range of charts, graphs, and visual elements. Infogram empowers you to utilize geographic context through the map library or your own maps, providing a spatial understanding that enhances your content marketing storytelling. Seamlessly import data from various formats or connect directly to popular online databases like MySQL, PostgreSQL, and Amazon Redshift.
By doing so, you can create compelling data-driven visualizations that elevate your narrative and provide valuable insights for data-driven decision-making, ensuring that your content marketing strategies are backed by reliable information.
Schedule a demo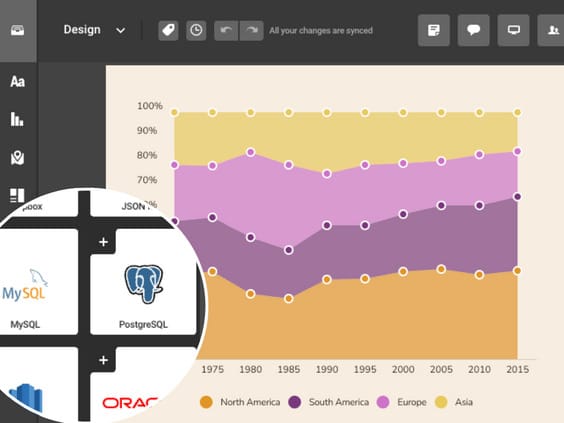
Seamless Data Import
Effortlessly import data from a variety of online databases, including MySQL, PostgreSQL, and Amazon Redshift, ensuring that your visualizations always reflect the most up-to-date information. Infogram streamlines the data entry process, allowing you to focus on analyzing and visualizing your data accurately, saving you time and effort in managing your data for content marketing campaigns.
Schedule a demo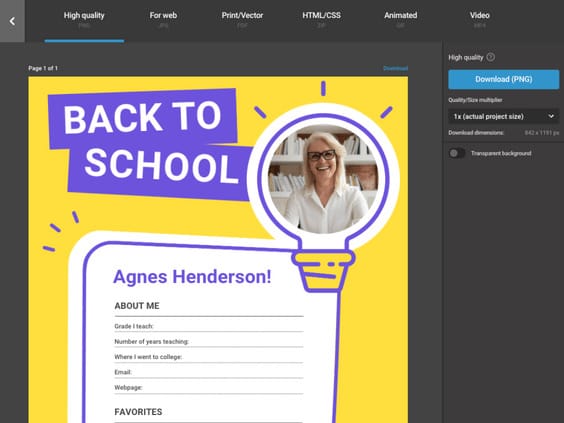
Streamlined Publishing and Sharing
Simplify your publishing and sharing efforts with Infogram's versatile range of output options. Whether you need high-quality PNG images for web use, printable PDFs for offline purposes, or full-screen presentations for immersive content marketing storytelling, Infogram has you covered.
Share your content effortlessly anywhere, in any format, and in any size that aligns with your specific requirements. Infogram's flexibility ensures that your content is easily accessible and optimized for various platforms and mediums, maximizing its reach and impact in your online marketing campaigns.
Schedule a demo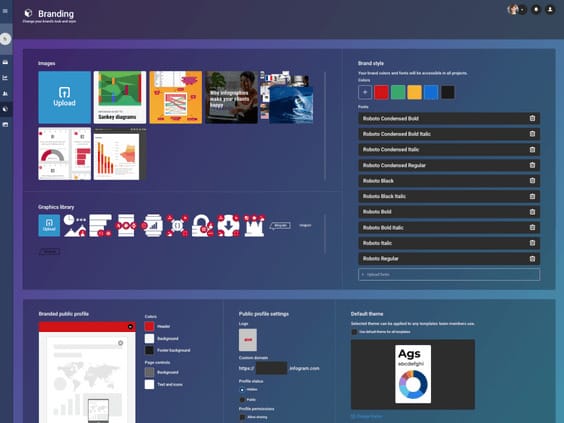
Maintain Brand Consistency
Uphold consistent branding across all your interactive content by seamlessly integrating your brand assets. By uploading your brand assets, such as logos, color schemes, and fonts, you can effortlessly apply them across all your projects.
This consistency ensures that your content marketing materials visually align with your brand identity, reinforcing brand recognition and creating a cohesive visual presence that strengthens your overall brand image.
Schedule a demo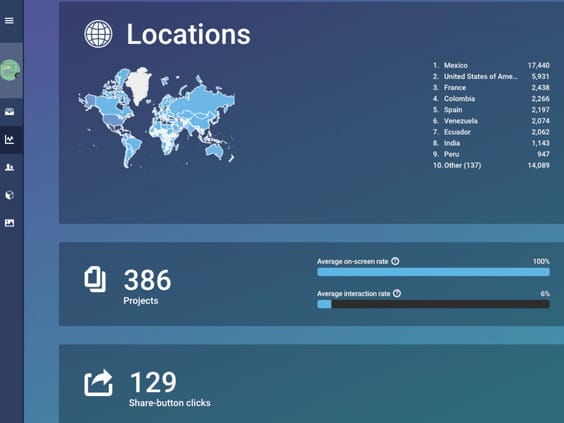
Uncover Valuable Insights with Comprehensive Analytics
Unlock meaningful insights into audience engagement and content shares with Infogram's robust analytics feature. Leverage these insights to make data-driven decisions and optimize your content strategy for maximum impact in your digital marketing efforts. Infogram's comprehensive analytics tools provide you with the necessary feedback to refine your online marketing campaigns, ensuring they resonate effectively with your target audience and drive desired results.
Schedule a demo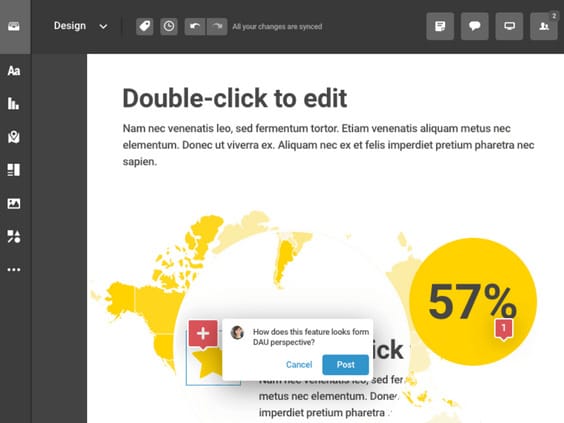
Make Collaboration Easy
Streamline collaboration with real-time features that promote seamless teamwork. Invite team members to collaborate on your reports in real-time, enabling multiple users to work simultaneously. This eliminates the need for back-and-forth emails or file sharing, making your reporting process more efficient and time-saving.
Additionally, Infogram's commenting and feedback functionalities allow team members to provide input directly on specific elements of the report, fostering effective communication and ensuring alignment when it comes to reporting, thus enhancing collaboration and driving better decision-making in your content marketing efforts.
Schedule a demoExplore Most Loved Features

Brand Kit
Ensure consistent branding across all your projects with a brand kit that allows you to upload and apply your brand's logos, color schemes, and fonts effortlessly.

Project Embeds
Integrate interactive visualizations directly into your website or blog, creating a more engaging and immersive experience for your audience.

Auto-Aligning Content
Effortlessly change the alignment of objects on your canvas with a simple click, allowing you to quickly create image galleries or dashboards.

Removing Image Background
Easily remove image backgrounds to focus on specific elements, enabling you to create photomontages and overlay objects seamlessly.

Annotations and Callouts
Add explanatory text, highlights, and insights to your data visualizations, providing context and enhancing audience understanding.

Real-Time Collaboration
Collaborate seamlessly in real time with team members, editors, and contributors, facilitating efficient teamwork and content creation.

Content Engagement Analytics
Gain valuable insights into audience behavior and engagement, enabling you to refine your content strategy based on real-time feedback.
Data Import
Effortlessly import data from various sources, ensuring accurate and up-to-date visualizations for your reports.

Chart Library
Choose from a diverse range of chart types, customize colors and labels, and present your data in a visually compelling way.

Map Library
Visually represent geographic data with various map styles and formats, enhancing the impact of your storytelling.
Get Inspired by Infogram User Created Projects
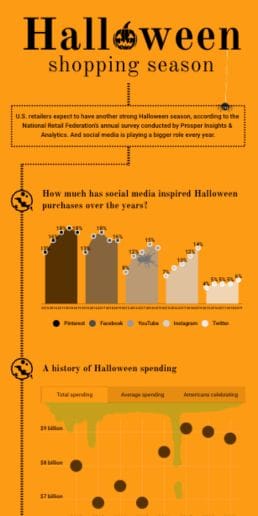
Halloween Shopping Season

A Different Kind of March Madness
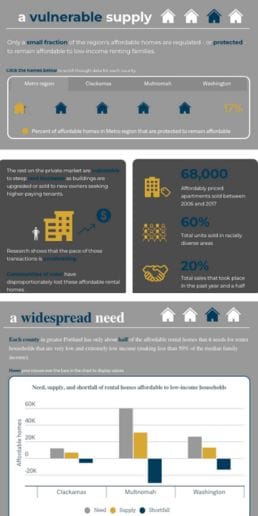
A snapshot of greater Portland's need for affordable homes
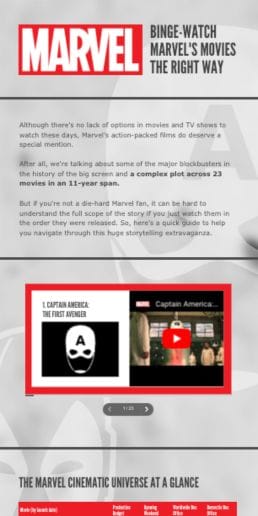
Marvels Movies Binge-Watch the Right Way
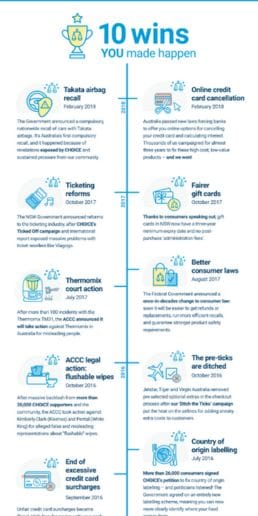
10 Wins You Made Happen

A Different Earth Day
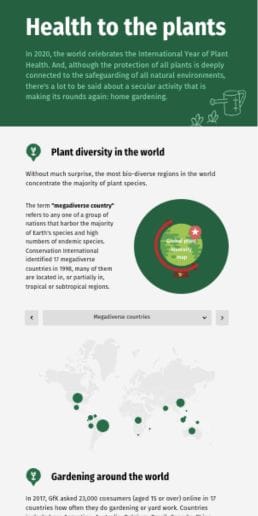
Health to the plants

Map: How Medicaid Helps Your State
Customer Reviews
Here is what our customers have to say about us.
2022 Summer & Fall and 2023 Winter leader in Data Visualisation Software 4.7 out of 5 stars
See reviews on G2 ›Empowering 30,000+ Companies Worldwide
From startups to established enterprises, our platform has been embraced by a diverse range of businesses seeking to captivate audiences and simplify complex data. Here are just a few examples of the 30,000+ companies that use Infogram.


Learn More Practical Tips
Marketing
Social media trends to expect in 2023
Business
Everything you need to know about visual branding + examples
Marketing
Brand storytelling: 4 brand story examples to inspire you
Organizations
The ultimate nonprofit marketing guide: Strategies and tools for success
Marketing
Data storytelling: Ingredients to an effective data story
Sales
How to effectively engage prospects with your sales presentation
Frequently Asked Questions
How can Infogram help me present data in an engaging way?
Infogram's chart library, interactive elements, and customizable design features enable you to present data in a visually appealing and interactive manner, capturing your audience's attention and enhancing their understanding.
Why is interactive content useful?
Interactive content is useful for several reasons:
- Increased Engagement: Interactive content is more engaging than traditional content because it allows users to participate actively and interact with the content. This can lead to higher levels of engagement, which can help to improve retention and increase the chances of users sharing the content with their friends and followers.
- Personalization: interactive content can be personalized to the user's interests or needs, making it more relevant and useful.
- Brand Awereness: Interactive content can help to increase brand awareness by providing a unique and memorable experience that users are likely to share with their friends and followers. This can help to increase your reach and build brand loyalty.
- Improved User Experience: Interactive content can help to improve the user experience by providing a more enjoyable and informative experience that meets their needs and interests.
How do you create interactive content in Infogram?
- Open your library.
- Choose a project you want to create (infographics, reports, slides etc.)
- If you want some inspiration, choose one of many Infogram templates or select a blank template to start from scratch.
- After you have chosen your project type and template, you can start editing your project (you can add charts, maps and other graphic elements that better suit your project).
Can I collaborate with my team on a project in Infogram?
Yes, Infogram provides real-time collaboration features that allow you to share reports with your team, gather feedback, and work together to create impactful reports.
What are content engagement analytics?
Analytics is an essential tool for measuring the success of your published content in the digital realm. With the ability to track key metrics and analyze data from different sources, you can gain important insights into the performance of your content strategy. This information allows you to optimize your approach and make data-driven decisions to drive engagement, conversions, and revenue growth.
Didn't find the answer? Check our FAQs

Try Infogram Now!
Are you ready to unleash the power of data visualization? Get started with Infogram today and create stunning, interactive content that captivates your audience. Elevate your projects and bring data to life.