06.04.2017 by Anete Ezera
Infogram started the new year with a bang! We made significant changes to our tool and added a couple highly-anticipated features. We increased interactive capabilities, added linking options, enhanced our legend offerings, and updated our chart settings.
Scroll down to view Infogram’s major product updates over the last few months:
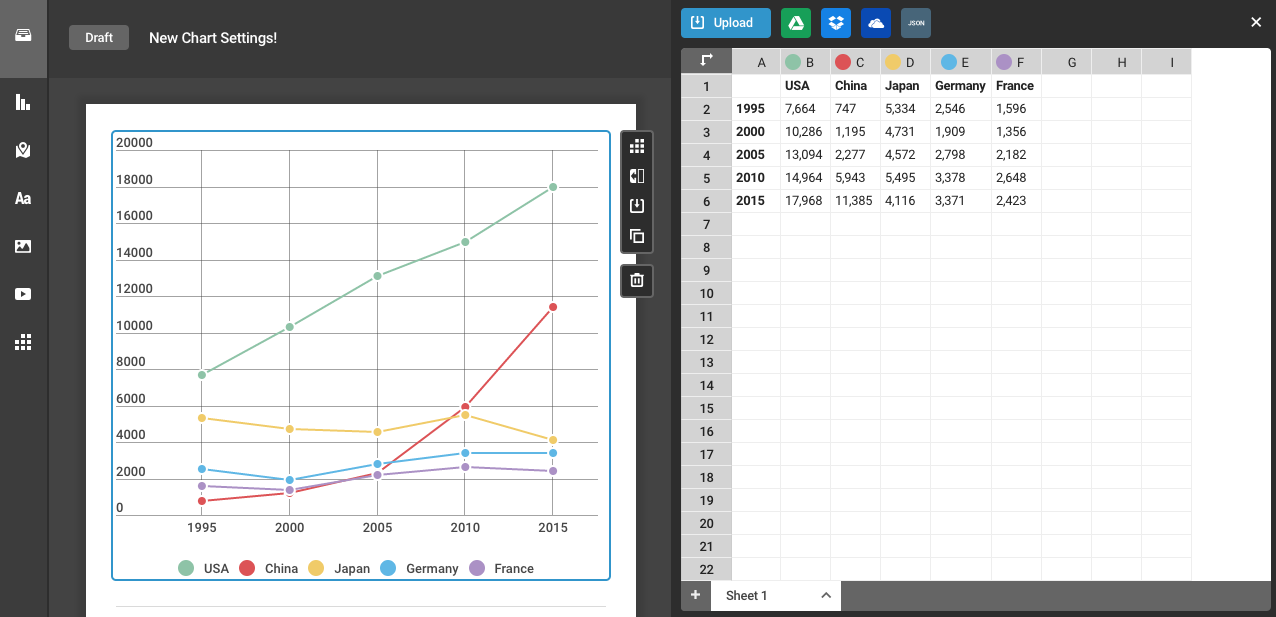
1) New Chart, Map and Graphic Settings
We have switched the format of Infogram’s interface. While designing your chart, you can now access the settings directly from the right-hand side. Use it to change colors, chart height, labels, and more. To edit the data, simply double-click on the chart.
The new settings bar is much more intuitive, allowing you to access different settings from the same place no matter where you are in the creation process.
2) Map Improvements
We launched a new map legend and added zoom settings to all of our maps. Now you can resize and zoom in on specific regions of the map, highlighting the data you want your viewer to focus on. All you need to do is click the magnifying glass in the top right corner and use your mouse to move the map.
Our new map legend not only looks great on static images, it also has amazing interactive functionality. Your viewer can hover their mouse over the legend to view different values and explore the data on their own.

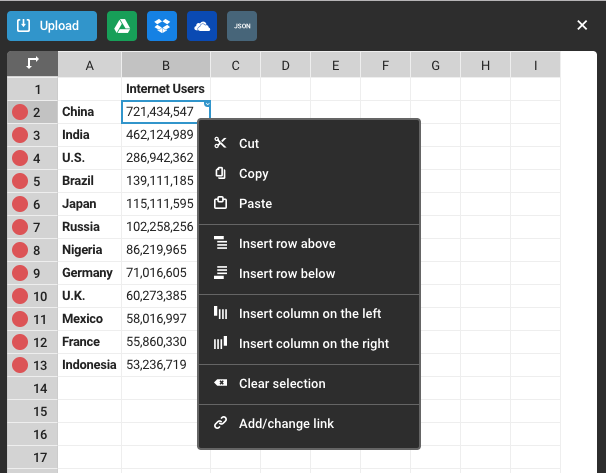
3) Add Links to Images, Icons, and Charts
Now you can add links to images, icons, maps, and chart elements – like the slice of a pie chart or bar of a bar graph. Your viewer will be directed to the URL you provide when they click. This is great because it offers more in-depth information for your viewer, and also has the ability to drive traffic to sites you’d like your viewer to visit.
4) 1 Million Images, Icons and Flags
Infogram offers over 1 million ready-to-use images, 500,000+ icons, and a large selection of official flags. Check it out below!
Would you like to experience the full power of data visualization? Try Infogram for Teams or Enterprise for free! With a Team or Enterprise account, you can create up to 10,000+ projects, collaborate with your team in real time, use our engagement analytics feature, and more. Request your free demo here.
5) Interactive Chart Legends
Your viewer has the ability to dive into your data with Infogram’s new interactive chart legends. They can select and de-select various categories, giving them the option to view the datasets most interesting to them. This new feature is available with stacked bar, stacked column, and other charts.
6) Faster Loading Time
Infogram is proud of our ongoing commitment to help users make beautiful charts that load quickly. We’ve made chart loading time up to 30% faster! That means your chart embeds will display in no time, which increases viewer engagement and the overall visualization experience.
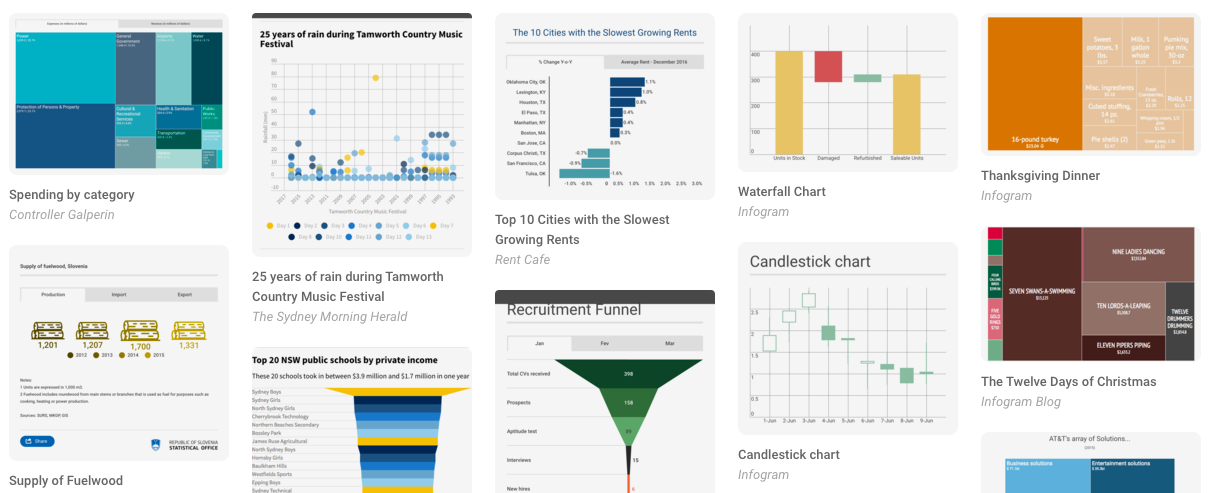
7) Chart & Infographic Examples
We’ve hand-selected a wonderful collection of impressive charts, infographics, reports, presentations and maps created by Infogram users. You can browse any chart type or enjoy featured projects. This is the perfect opportunity to see what Infogram can do.
If you’d like more product updates, sign up for Infogram’s weekly newsletter. We will make sure you have fun stories, tips, and trends in your inbox every week.
Get data visualization tips every week:
New features, special offers, and exciting news about the world of data visualization.